|

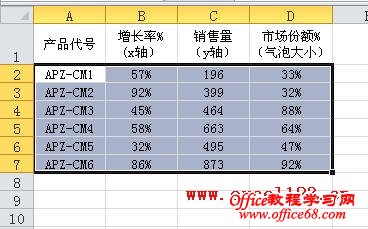
但这种方法在数据较多时比较繁琐,如果用VBA代码来完成则较为快捷。在Excel 2007/2010中,如果数据区域在相邻的四列中,要设置第一列为图例中显示的文本内容,第二列为x轴,第三列为y轴,第四列为气泡大小,选择数据区域中不包含第一行标题的四列,如图:

然后执行下面的代码:
Sub AddBubble()
'适用于Excel2007/2010
Dim objCht As Chart
Dim i As Integer
Dim iRows As Integer, iCols As Integer
Dim rRng As Range
Set rRng = Selection
iRows = rRng.Rows.Count
iCols = rRng.Columns.Count
If iCols = 4 Then
Set objCht = ActiveSheet.ChartObjects.Add(100, 80, 400, 250).Chart
For i = 1 To iRows
With objCht.SeriesCollection.NewSeries
.ChartType = xlBubble3DEffect
.Name = rRng.Item((i - 1) * 4 + 1)
.XValues = rRng.Item((i - 1) * 4 + 2)
.Values = rRng.Item((i - 1) * 4 + 3)
.BubbleSizes = rRng.Item((i - 1) * 4 + 4)
End With
Next
End If
End Sub
在Excel 2003中执行下列代码:
Sub AddBubbleFor2003()
'适用于Excel2003
Dim objCht As Chart
Dim rRng As Range
Dim i As Integer
Dim iRows As Integer, iCols As Integer, irow As Integer, icol As Integer
On Error GoTo line1
Set rRng = Selection
iRows = rRng.Rows.Count
iCols = rRng.Columns.Count
irow = rRng.Row
icol = rRng.Column
If iCols = 4 Then
rRng.Offset(0, 1).Resize(1, 3).Select
Set objCht = ActiveSheet.ChartObjects.Add(100, 80, 450, 250).Chart
objCht.SetSourceData Source:=Selection
For i = 1 To iRows
With objCht
.SeriesCollection.NewSeries
.ChartType = xlBubble3DEffect
.SeriesCollection(i).Name = rRng.Item((i - 1) * 4 + 1)
.SeriesCollection(i).XValues = rRng.Item((i - 1) * 4 + 2)
.SeriesCollection(i).Values = rRng.Item((i - 1) * 4 + 3)
.SeriesCollection(i).BubbleSizes = "=" & ActiveSheet.Name & "!R" & irow + i - 1 & "C" & icol + 3
End With
Next
End If
line1:
End Sub
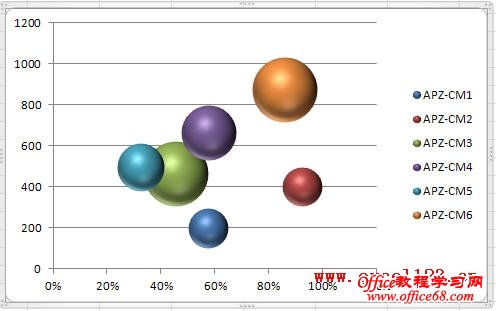
上述代码根据所选区域数据创建一个三维气泡图,并将各行数据设置为不同的系列,从而在图例中显示各系列名称。
|