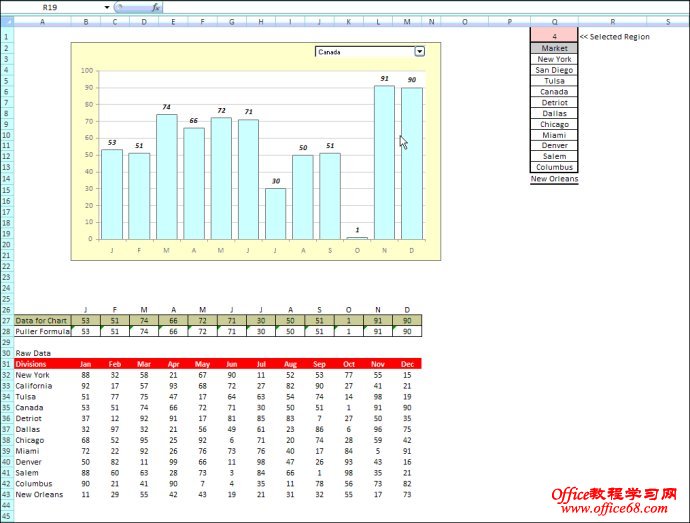
|
Sub Chart1Change()
Const OldData As String = "B27:M27" '<<Change this Range
Const NewData As String = "B28:M28" '<<Change this Range
Call AnimateChart(OldData, NewData)
'Optional Auto-Adjust Procedure to fix data labels
'For details see:
'http://datapigtechnologies.com/blog/index.php/auto-adjust-chart-label-positions/
Call LabelAdjust(ActiveSheet.ChartObjects("Chart 1").Chart)
End Sub
Function AnimateChart(OldDataSet As String, NewDataSet As String)
Dim NewData As Variant
Dim OldData As Variant
Dim AnimationArray As Variant
Dim OldPoint As Long
Dim NewPoint As Long
Dim x As Integer
Dim i As Integer
Dim p As Double
NewData = ActiveSheet.Range(NewDataSet).Value
OldData = ActiveSheet.Range(OldDataSet).Value
AnimationArray = ActiveSheet.Range(NewDataSet).Value
For i = 1 To 5
p = 1 / 5 * i
For x = 1 To WorksheetFunction.Count(NewData)
OldPoint = OldData(1, x)
NewPoint = NewData(1, x)
AnimationArray(1, x) = OldPoint - (OldPoint - NewPoint) * p
Next x
Range(OldDataSet).Value = AnimationArray
DoEvents
Next i
End Function
Function LabelAdjust(TargetChart As Chart)
Dim MaxScale As Long
Dim MinScale As Long
Dim MySeries As Series
Dim MyPoint As Long
Dim PointsArray As Variant
Dim DefaultPosition As Long
Dim AdjustedPosition As Long
'Identify Chart and capture min and max scales
With TargetChart
MaxScale = .Axes(xlValue).MaximumScale
MinScale = .Axes(xlValue).MinimumScale
'Start looping through series
For Each MySeries In .SeriesCollection
'Exit loop if the series is not a column or line chart
If MySeries.ChartType <> xlColumnClustered And _
MySeries.ChartType <> xlLine And _
MySeries.ChartType <> xlLineMarkers Then
GoTo SKIPSERIES
End If
'Trap data points in an array that can be looped
PointsArray = MySeries.Values
For MyPoint = LBound(PointsArray) To UBound(PointsArray)
'Skip the point if no data label
If MySeries.Points(MyPoint).HasDataLabel = False Then
GoTo SKIPPOINT
End If
'Process rules by chart type
If MySeries.ChartType = xlColumnClustered Then
MySeries.Points(MyPoint).DataLabel.Position = xlLabelPositionOutsideEnd
If PointsArray(MyPoint) > MaxScale * 0.9 Then
MySeries.Points(MyPoint).DataLabel.Position = xlLabelPositionInsideEnd
End If
End If
If MySeries.ChartType = xlLine Or MySeries.ChartType = xlLineMarkers Then
MySeries.Points(MyPoint).DataLabel.Position = xlBelow
If MyPoint > 1 Then
If PointsArray(MyPoint) > PointsArray(MyPoint - 1) Then
MySeries.Points(MyPoint).DataLabel.Position = xlAbove
Else
MySeries.Points(MyPoint).DataLabel.Position = xlBelow
End If
End If
If PointsArray(MyPoint) > MaxScale * 0.9 Or _
PointsArray(MyPoint) < MinScale * 1.5 Then
MySeries.Points(MyPoint).DataLabel.Position = xlRight
End If
End If
SKIPPOINT:
Next MyPoint
SKIPSERIES:
Next MySeries
End With
End Function

利用excel实现动态图表渐变效果的代码 | 